A Proven Track Record

Results from January 1st 2012 to December 31st 2024 using the Continuation Trade 
Auto​mated Robot trading the Nasdaq Contract (NQ)

Standard Settings

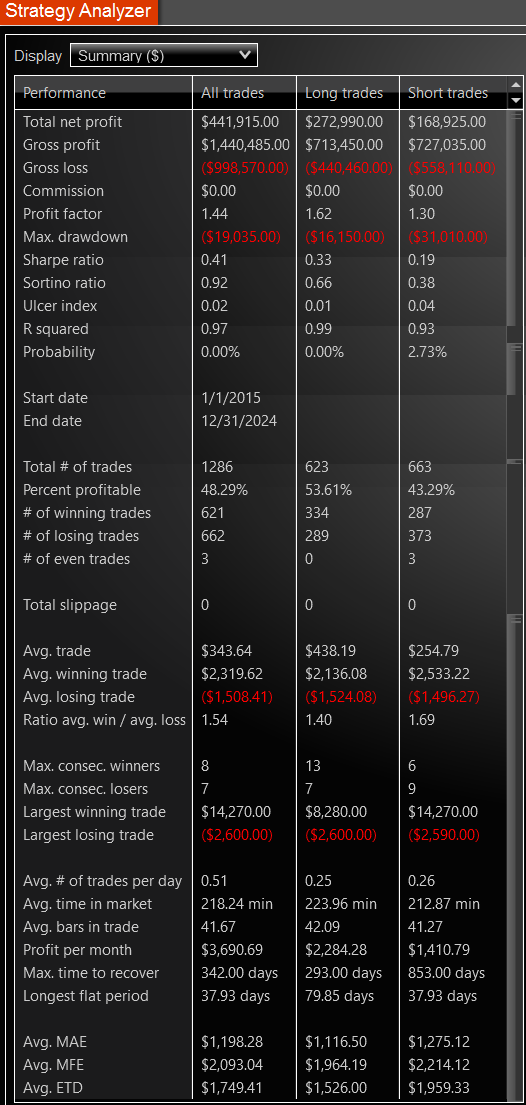
Total Net Profit: $441,915*
Profit Factor: 1.44
Winning Percentage: 48.29%
Max Draw Down: $19,035
Consistent year-over-year

See THE FULL Day by Day results BELOW
* Results do not factor in compounded interest or increasing position sizing as your account grows

Aggressive Settings 
(longs only)

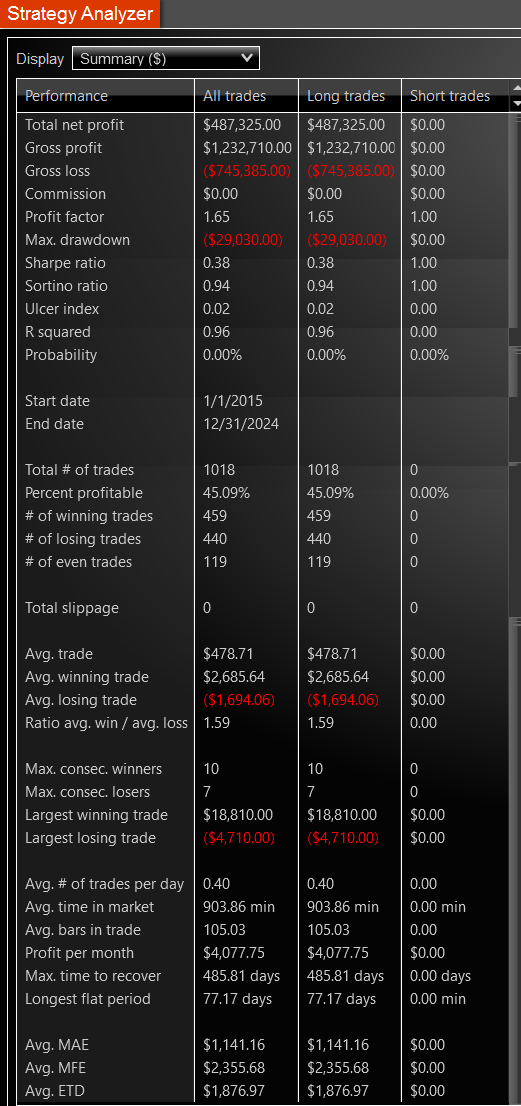
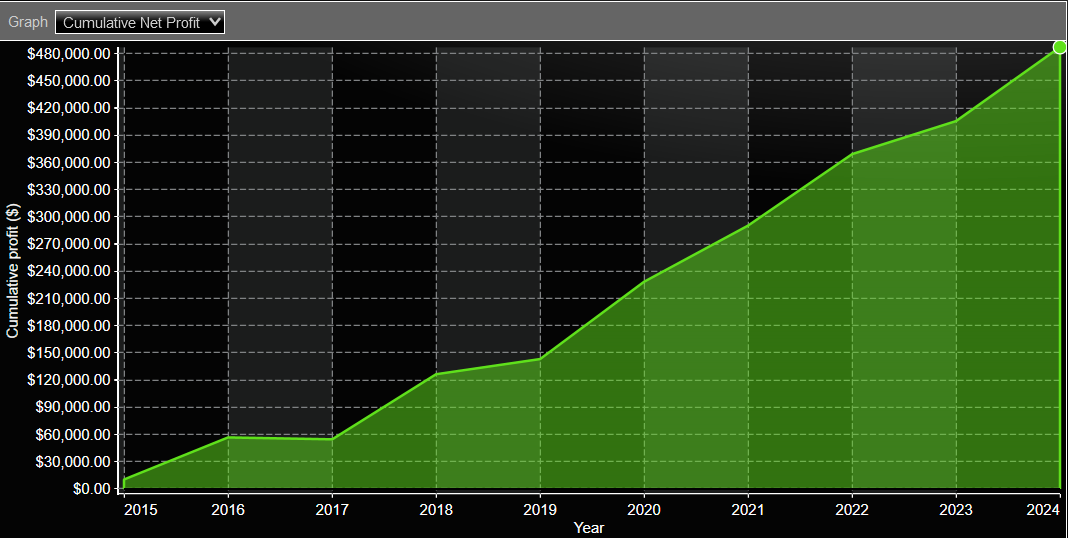
Total Net Profit: $487,325*
Profit Factor: 1.65
Winning Percentage: 45.09%
Max Draw Down: $29,030
Consistent year over year

See THE FULL Day by Day results BELOW
* Results do not factor in compounded interest or increasing position sizing as your account grows

Conservative Settings
longs only

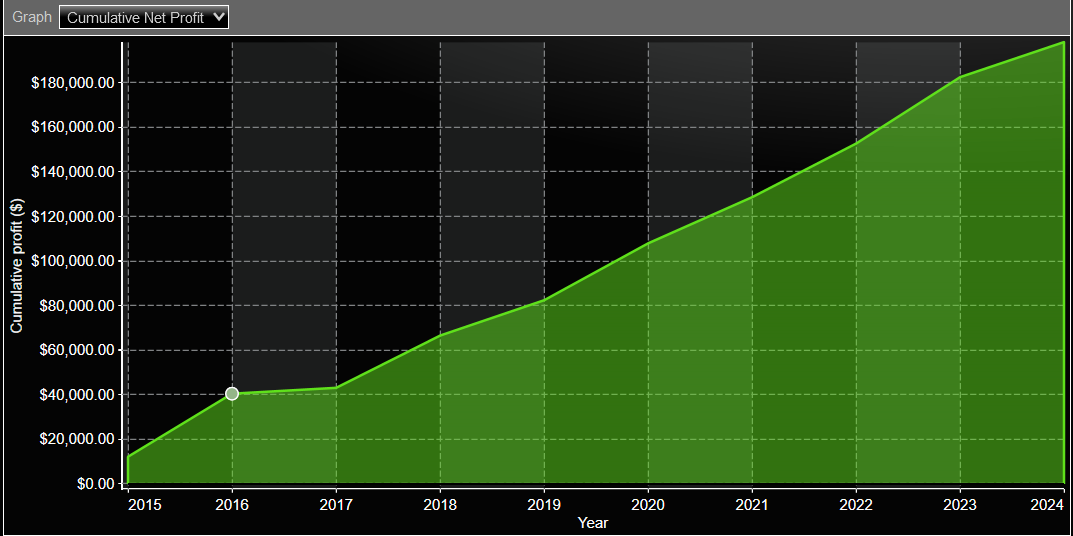
Total Net Profit: $198,215*
Profit Factor: 2.24
Winning Percentage: 59.52%
Max Draw Down: $5,930
Consistent year-over-year

See THE FULL Day by Day results BELOW
* Results do not factor in compounded interest or increasing position sizing as your account grows

Conservative Settings
shorts only

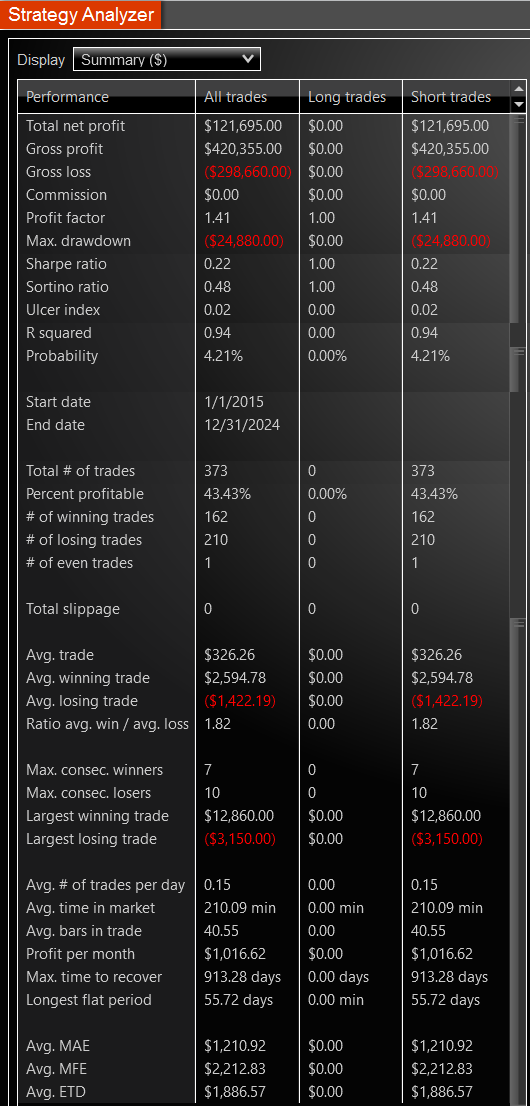
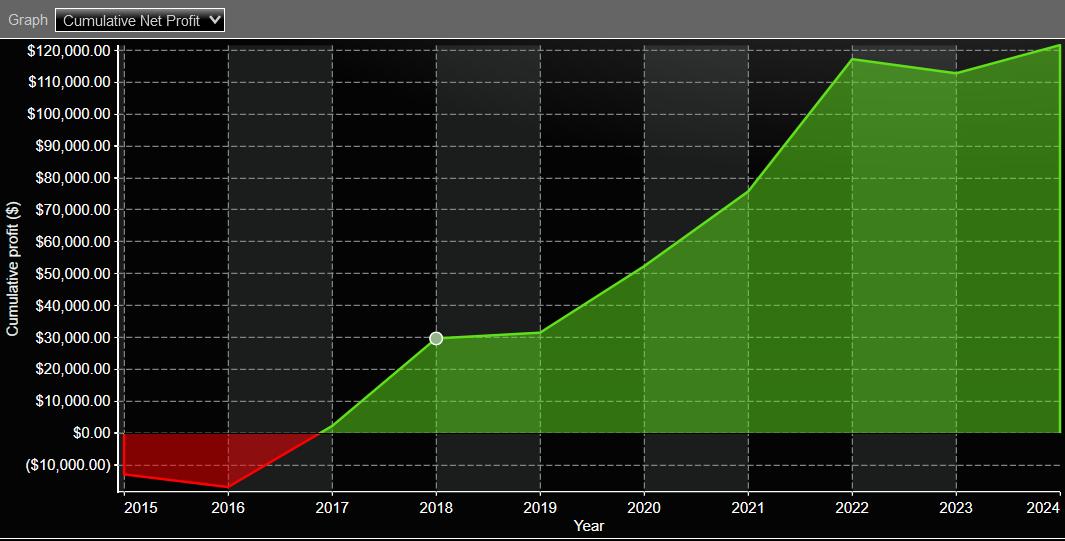
Total Net Profit: $121,695*
Profit Factor: 1.41
Winning Percentage: 43.43%
Max Draw Down: $24,880
Consistent year over year

See THE FULL Day by Day results BELOW
* Results do not factor in compounded interest or increasing position sizing as your account grows

Equity Curve 2015 - Dec 31st 2024 Standard Settings

Equity Curve 2015 - Dec 31st 2024 Conservative Settings (longs only)

Equity Curve 2015 - Dec 31st 2024 Conservative Settings (shorts only)

Continuation Trade - Results 
2015 - 2024

Standard Settings

Aggressive Settings

Conservative Settings (longs only)

Conservative Settings
shorts only
Year by Year Results 2012 - 2024